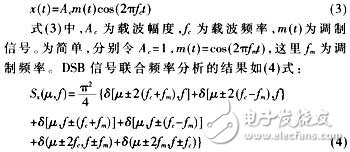
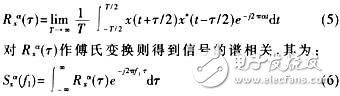
Signal modulation method recognition plays an important role in applications such as radio management and electronic countermeasures. Since Waver CS et al. published the first paper on automatic identification of modulation methods in 1969, new methods such as Liang have been proposed in this field. Hong and KCHo use wavelet transform to identify three digital modulated signals FSK, PSK and 16QAM [1]; Gardner uses cyclic spectrum analysis for signal modulation and recognition [2]; Assaleh et al. model the signal as a two-order AR process, and The parameter statistics method is used to identify three types of signals: CW, PSK and FSK [3]. Signal modulation recognition generally includes two important parts, namely inter-class recognition and intra-class recognition. This paper focuses on the inter-class identification of FSK, PSK and multi-tone FDM signals. Multi-tone FDM is a multi-carrier signal, which needs to be analyzed by time-frequency method. However, the time-frequency cannot simply reflect the characteristics of the signal. For this reason, this paper first introduces the application of Fourier transform to the time-frequency distribution of each frequency band. The frequency analysis method is used to illustrate the characteristics of the method by DSP signal. Then, according to the spectral correlation cycle frequency spectrum, the advantages of signal cyclostationary characteristics are characterized, and the two-dimensional processing method of joint signal frequency and cycle frequency is obtained by replacing the Fourier transform. It is also used for feature analysis of three digital signals. Finally, the feature extraction and recognition process based on joint frequency analysis is introduced in detail, and the simulation test results are given. 1 joint frequency analysis 1.1 Joint frequency analysis based on Fourier transform Let the signal be x(t), first perform Fourier transform on its instantaneous autocorrelation function to get a two-dimensional function about time and frequency, namely the famous Wigner-Ville time-frequency distribution [4]: Where μ is the modulation frequency, and the double-band amplitude modulation signal (DSB) is taken as an example to illustrate the characteristics of the joint frequency analysis. The expression of the DSB signal is: It can be seen from equation (4) that there are multiple non-zero values ​​on the joint plane of the signal frequency and the modulation frequency, and the positions where these values ​​appear have symmetry (only the case of μ≥0, f≥0 is analyzed in this paper). Obviously, non-zero values ​​in the range |μ| ≤ 2fm reflect some of the characteristics of the modulated signal. These features are generally concentrated at lower modulation frequencies (μ) than signal carrier frequencies, and non-zero values ​​in other ranges, mainly due to Wigner-Ville distribution (SWD), smooth pseudo-Wigner-Ville distribution (SPWD) [4] ]Wait. Since the FFT is used to calculate the Fourier transform, the joint analysis plane contains a lot of high-frequency redundant information, which reduces the analysis efficiency, and the communication signal generally has the characteristics of cyclostationary. Therefore, the design uses the spectral correlation μ-section analysis to replace the second-generation Fourier transform. The basics are described below. 1.2 Spectral correlation theory Let the signal x(t) microcirculation be stable and the power is limited, then its cyclic autocorrelation function in the time interval [-T, T] is: The spectral correlation of the signal is a formal two-dimensional Fourier spectrum. The two variables are F1 and a, respectively, let f1=0, and obtain the spectral correlation Sxa(0) on the a-axis of the cyclic frequency, abbreviated as a-axis spectrum. The a-axis spectrum generally contains important information related to the signal carrier frequency, symbol rate, etc. [5]. Water Proof Axial Fan ,Compact Axial Fan,Axial Air Fan,Co Axial Fan Hangzhou Jinjiu Electric Appliance Co Ltd. , https://www.jinjiufanmotor.com